
National (CA)
Type of resources
Topics
Keywords
Contact for the resource
Provided by
Years
Formats
Representation types
Update frequencies
status
-
This collection of data summarizes the companies and facilities reporting under the Fuels Information Regulations, No. 1. This dataset includes total fuel volumes, sulphur contents and masses, and companies reporting production and/or importation of liquid fuels originating from crude oils, coal or bituminous sand. The information was provided to Environment and Climate Change Canada under the Canadian Environmental Protection Act, 1999.
-
This collection houses PDFs of active BBS route maps, which are grouped by province or territory. These maps allow BBS volunteers in Canada to easily locate the start of their route, and to navigate the official route. The BBS is jointly coordinated by Environment Canada's Canadian Wildlife Service and the U.S. Geological Survey (USGS), Patuxent Wildlife Research Center. Any use of BBS data for Canada should acknowledge the hundreds of skilled volunteers in Canada who have participated in the BBS over the years, those who have served as provincial or territorial coordinators for the BBS, and the Boreal Avian Modelling Project (BAM; www.borealbirds.ca), whose collaboration was invaluable to the creation of the BBS route and stop location dataset.
-
This database contains detailed information on various sorbents (materials used to absorb chemicals) with a particular emphasis on the compunds abilities to absorb oil from tanker spills.
-
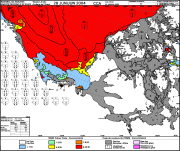
The Canadian Ice Service maintains a collection of Daily ice charts, Regional ice charts and Iceberg charts. These charts are available in GIF format and E00 (Regional Charts only).
-
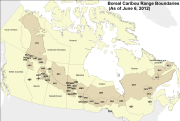
As part of a scientific assessment of critical habitat for boreal woodland caribou (Environment Canada 2011, see full reference in accompanying documentation), Environment Canada's Landscape Science and Technology Division was tasked with providing detailed anthropogenic disturbance mapping across known caribou ranges. This data allowed researchers to better understand the attributes that have a known effect on caribou population persistence. The mapping process was established to create a nationally consistent, reliable and repeatable geospatial dataset that followed a common methodology. The methods developed were focused on mapping disturbances at a specific point of time, and were not designed to identify the age of disturbances, which can be of particular interest for disturbances that can be considered non-permanent, for example cutblocks. The resultant datasets were used for caribou resource selection function,habitat modeling, and assess overall disturbance levels on each caribou ranges. Anthropogenic disturbances within 57 caribou ranges across Canada were mapped. The ranges were defined by individual Provinces and Territories across Canada. Disturbances were mapped across these ranges using 2008-2010 Landsat-5 satellite imagery to provide the most up to date data possible. Originally some areas were mapped to match the date of collected caribou demographic data, however more recent imagery was used and additional disturbance features that were seen since the original mapping date were added. Within the context of this project, anthropogenic disturbance was defined as any human-caused disturbance to the natural landscape that could be visually identified from Landsat imagery at a viewing scale of 1:50,000. A minimum mapping unit (MMU) of 2 ha or approximately 22 contiguous Landsat pixels was selected. Each disturbance feature type was represented in the database by a line or polygon depending on their geometric description. Polygonal disturbances included: cutblocks, mines, reservoirs, built-up areas, well sites, agriculture, oil and gas facilities, as well as unknown features. Linear disturbances included: roads, railways, powerlines, seismic exploration lines, pipelines, dams, air strips, as well as unknown features. For each anthropogenic feature type, a clear description was established (see Appendix 7.2 of the science assessment) to maintain consistency in identifying the various disturbances in the imagery by the different interpreters. Various ancillary vector datasets were used as aids in detecting, classifying and digitizing disturbances on the Landsat imagery (a table listing these datasets and their sources has been included in a separate file). Ancillary data was used to guide interpretation and feature labelling since the ancillary data was often variable across the country in terms of completeness as well as scale. As a result, features were only digitized if they were visible in the Landsat imagery at a viewing scale of 1:50,000. A 2nd interpreter quality control phase was carried out to ensure high quality, completete and consistent data collection. A quality assessment analysis, since an actual accuracy assessment was not possible, using high resolution SPOT imagery was carried out on a sample basis. Results are included in accompanying documentation. The vector data was buffered by 500m (radius) representing the zone of influence impacting boreal caribou herds in order to calculate range disturbance levels as well as for use in the integrated risk assessment analysis. Fire polygons were merged into the anthropogenic footprint in order to create an overall disturbance footprint.
-
The dataset contains the blended (gauge and satellite estimates) monthly mean precipitation rates (unit: mm/day) for Canada for the period from January 1979 to December 2007, at a half degree spatial resolution. Please refer to the paper below for the details of the blending algorithm and input gauge and satellite data. Reference: Lin, A. and X. L. Wang, 2011: An algorithm for Blending Multiple Satellite Precipitation Estimates with in-situ Precipitation Measurements in Canada. JGR-Atmospheres, 116, D21111, doi:10.1029/2011JD016359.
-
This daily forecast describes the ice edge using latitude and longitude coordinates, the total ice concentration, the predominant ice stage of development and the concentration of the oldest ice type. Warnings are issued as appropriate. The forecasts are valid from the time of issue until the end of the following day (so for a period of 24 to 48 hours).
-
This collection of data summarizes the companies reporting under the Renewable Fuels Regulations. This data set includes total liquid petroleum fuel volumes, renewable fuel volumes, and compliance unit creation. This data set also includes information on compliance by company. The information was provided to Environment and Climate Change Canada under the Canadian Environmental Protection Act, 1999.
-
This daily forecast describes the ice edge using latitude and longitude coordinates, the total ice concentration, the predominant ice stage of development and the concentration of the oldest ice type. Warnings are issued as appropriate. The forecasts are valid from the time of issue until the end of the following day (so for a period of 24 to 48 hours).
-
This daily forecast describes the ice edge using latitude and longitude coordinates, the total ice concentration, the predominant ice stage of development and the concentration of the oldest ice type. Warnings are issued as appropriate. The forecasts are valid from the time of issue until the end of the following day (so for a period of 24 to 48 hours).